2015年になり様々なアプリが2014年の年間収益を公開していますが、そんな中、それらのデータから「App Storeの収益形状」という面白い記事をMetakite Softwareの開発者Charles Perryさんが書いています。詳細は以下から。

この記事を読む前に「パレート分布(またはパレートの法則)」という法則を知っておくと以下のグラフがどれだけ凄いかわかりやすいと思うので幾つか例を挙げると、パレートの法則はいわゆる「80:20の法則」で
・ある会社の社員20%がその会社の仕事80%を行っている。
・世界の富の80%は世界の20%の富裕層が所有している。
というような統計則で、実際は更に偏りがあることからCharlesさんもApp Store収益の90~95%を10~5%の開発者が売り上げていると予想していたそうですが、それは予想を上回るものだったそうです。
&vquot;The Shape of the App Store,&vquot; in which I use @OvercastFM data to calculate revenue distribution in the App Store. http://t.co/pbNrsciIU6
To provide some context to the results, you may be familiar with the Pareto distribution. It’s the origin of the classic “80-20 rule” that’s used to explain so many phenomena that obey a power law. “Twenty percent of the people in an organization do eighty percent of the work.” “Twenty percent of the population control eighty percent of the wealth.” You hear these types of statistics a lot, but they’re usually not very accurate. Often, they are useful as a first estimate at best. So I didn’t actually expect App Store revenue to obey the 80-20 rule. In fact, I expected it to be a much sharper curve, representing even greater disparity in the distribution of revenue than the 80-20 rule would suggest – maybe a 90-10 split, or even a 95-5 split. As it turns out, the revenue distribution curve of the App Store is even sharper than I imagined.
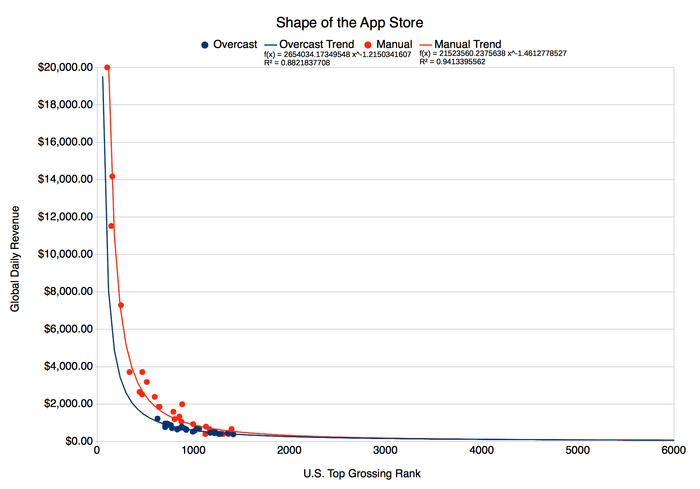
CharlesさんがまとめたのはInstapaper元開発者のMarco Armentさんが現在開発しているOvercastアプリと、William Wilkinsonさんが開発している Manualというカメラアプリの収益データで、これらのデータをApp Storeランキングと売上についてプロットすると以下の様な相関関係が得られるそうです。
「私はアイスホッケー用スティックの様な特徴の冪乗則を期待していましたが、ここまでのカーブは期待していなかった。
このティックは米App Storeの売上 Top 870あたりで折れます。
App Storeには約120万のあるアプリがあるというデータを使用すると、ほぼ間違いなく99.93%はApp Storeの”ロングテール”に置かれている。
App Storeの”頭”であるTop 870アプリはApp Store全体の0.07%で、それらの人気アプリがApp Store収益の40%以上を占めている」

I expected a “hockey stick” curve that’s characteristic of power law models, but I didn’t expect one like this.
The hockey stick breaks upwards at around position 870 on the U.S. Top Grossing list.
With about 1.2 million apps in the App Store at the time the data was collected, that arguably puts 99.93% of apps in the “long tail” of the App Store.
The “head” of the App Store, those 870 top grossing apps that make up 0.07% of the App Store population, collect over 40% of the App Store revenue that’s paid out.
これだけ見ると凄い偏りですが、幸いな事に”ロングテール”にあるアプリでも871位のアプリは年間260,000ドル、1908位で年間100,000ドル、3175位でアメリカの平均年収53,891ドルを得られるので、米売り上げランキング約6000位付近にあるアプリでも十分にビジネスになるチャンスがあるとも予想しています。
Luckily, there’s a lot of money to be made in that long tail. At the top of the long tail, in position 871 on the U.S. Top Grossing list, an app still makes over $700 in revenue per day. That’s almost $260,000 per year. Even number 1,908 on the U.S. Top Grossing list makes over $100,000 per year. In fact all apps above number 3,175 on the U.S. Top Grossing list produce enough revenue to at least make its developer the United States household median income for 2014 ($53,891). And this is just for a single app. Most indies I know develop more than one app simultaneously. Developers who can put together a collection of apps that rank at about 6000 on the U.S. Top Grossing list (about $25,000 in revenue per year) stand a good chance of building an app business that can sustain them and their families.
注:Manualのデータは後から追加され、±133ドル/日の誤差があり、App Store全体としては大した値ではありませんが、”ロングテール”にあるアプリには重要な値になっています(詳しくは関連リンクへどうぞ)。
関連リンク:
・The Shape of the App Store, Redux – Metakite Software
・The Shape of the App Store – Metakite Software
・Kapeli、Mac/iOSの定番スニペット&APIドキュメントアプリ「Dash」の2014年度収益を公開


コメント
すっげーナイアガラ
お試しが無いからね。
だから評判で買うしかないんだ。
グラフの見方分かんないんだけど、どうやって見るのこれ?
横軸がApp Storeのランキングで、
縦軸がその売上だね。
アプリを買う
売れ筋としておすすめされる
それを見てまた大量に売れる
一方でおすすめされないのは売れない
売れ筋でないとApp Storeで埋もれる
の繰り返しが極端だってことか。
どうしてもログスケールになるよな、売れるものを再現性よく作ってる開発者もいるのだろか
>>3
>>4さんの通り横軸がApp Storeランキング(1位から)で縦軸が1日の売上だね。
アメリカのApp Store市場で1位になれば約230万円の日当が貰える。
あと補足すると上のタイトル下に小さく書かれてるf(x) = 2565034x^(-1.21503)ていう式が補間式でy=f(x)が1日の売上、xがランキング順位だからExcelとかで描いてみるといいよ。
色々な計算方法があるけど、Charlesさんの式を積分Integral_{1}^{870} f(x) dxすると全アプリの売上(Integral_{1}^{120万} f(x) dx)の40%になるはず。
自分自身は開発者じゃないからわからないけど、上位にあるアプリはiTunes Storeのトップ画面に表示されるから売上も指数関数的に上がるんじゃないかな?
昨今YouTuberの2極化が話題になっているけど、このグラフを見るとApp Storeはもう何年も前から2極化になっていたと思うね。